Global poverty map analysis
Summary of task
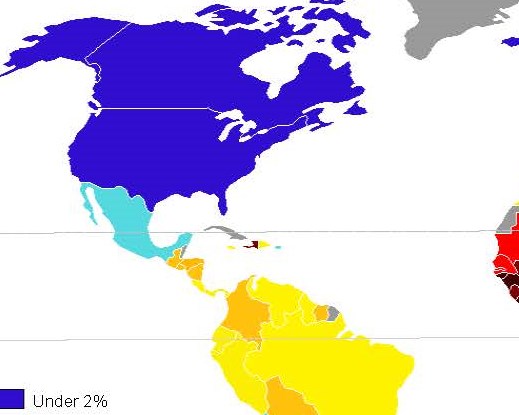
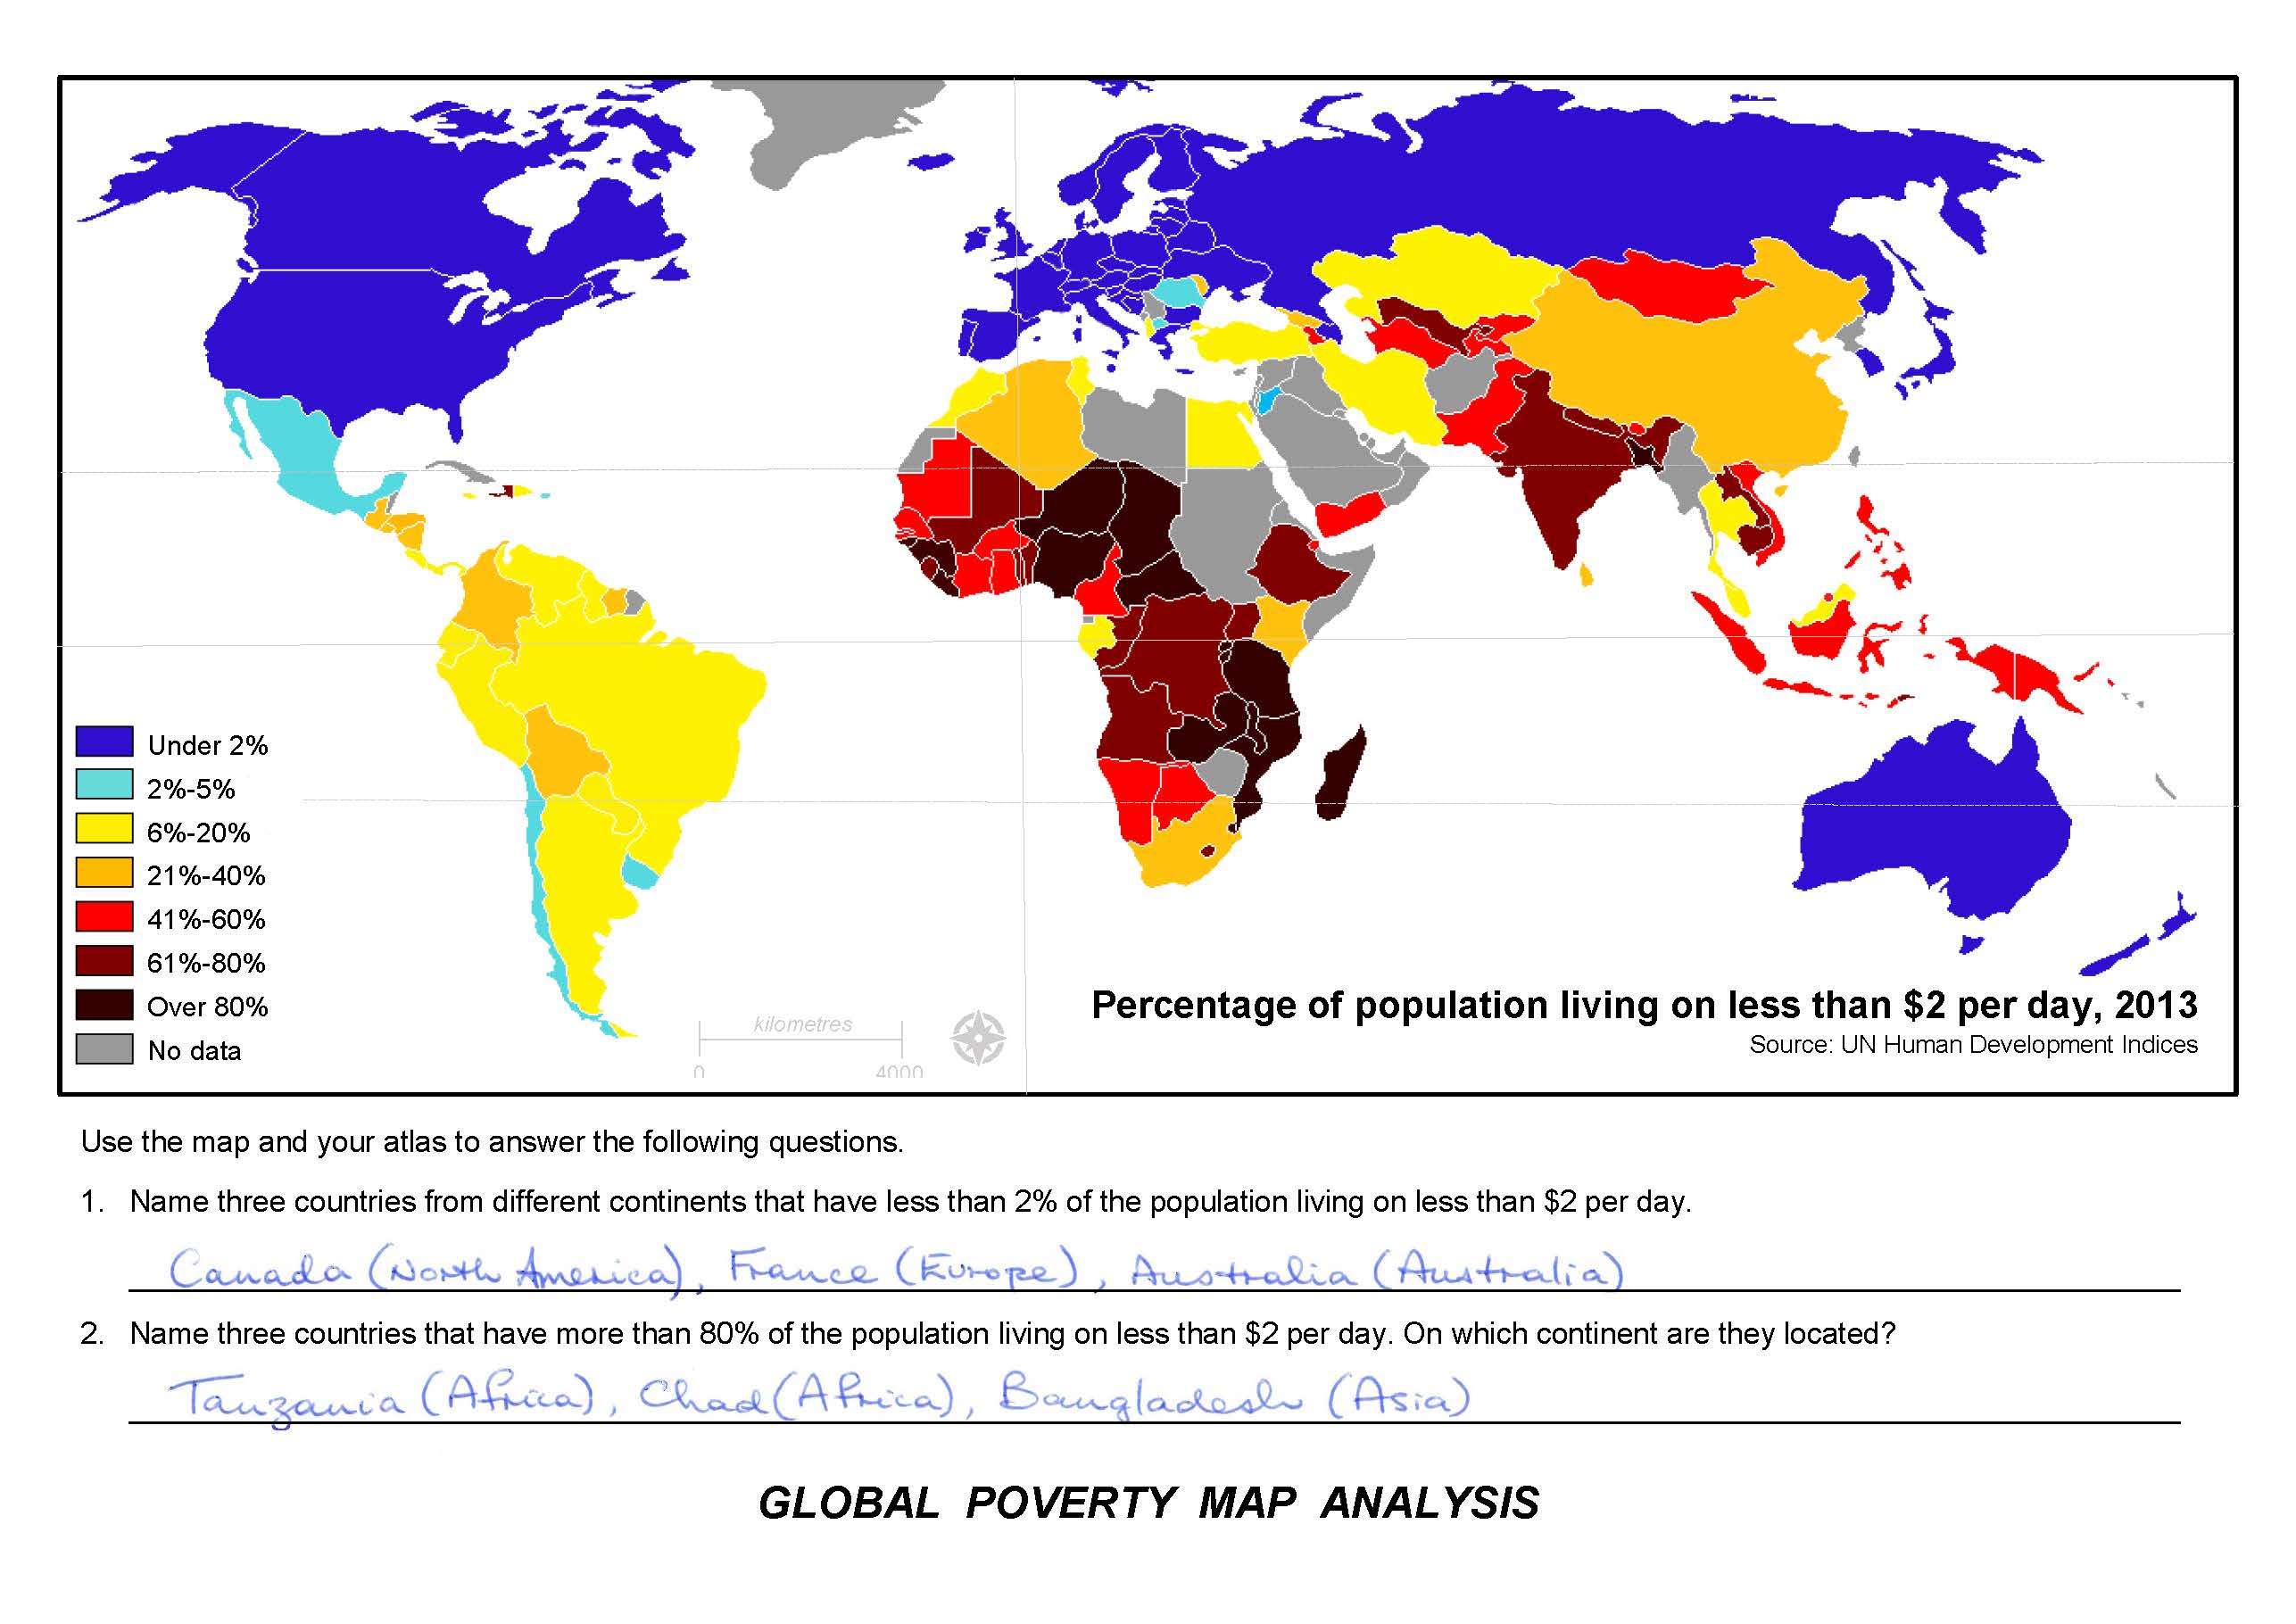
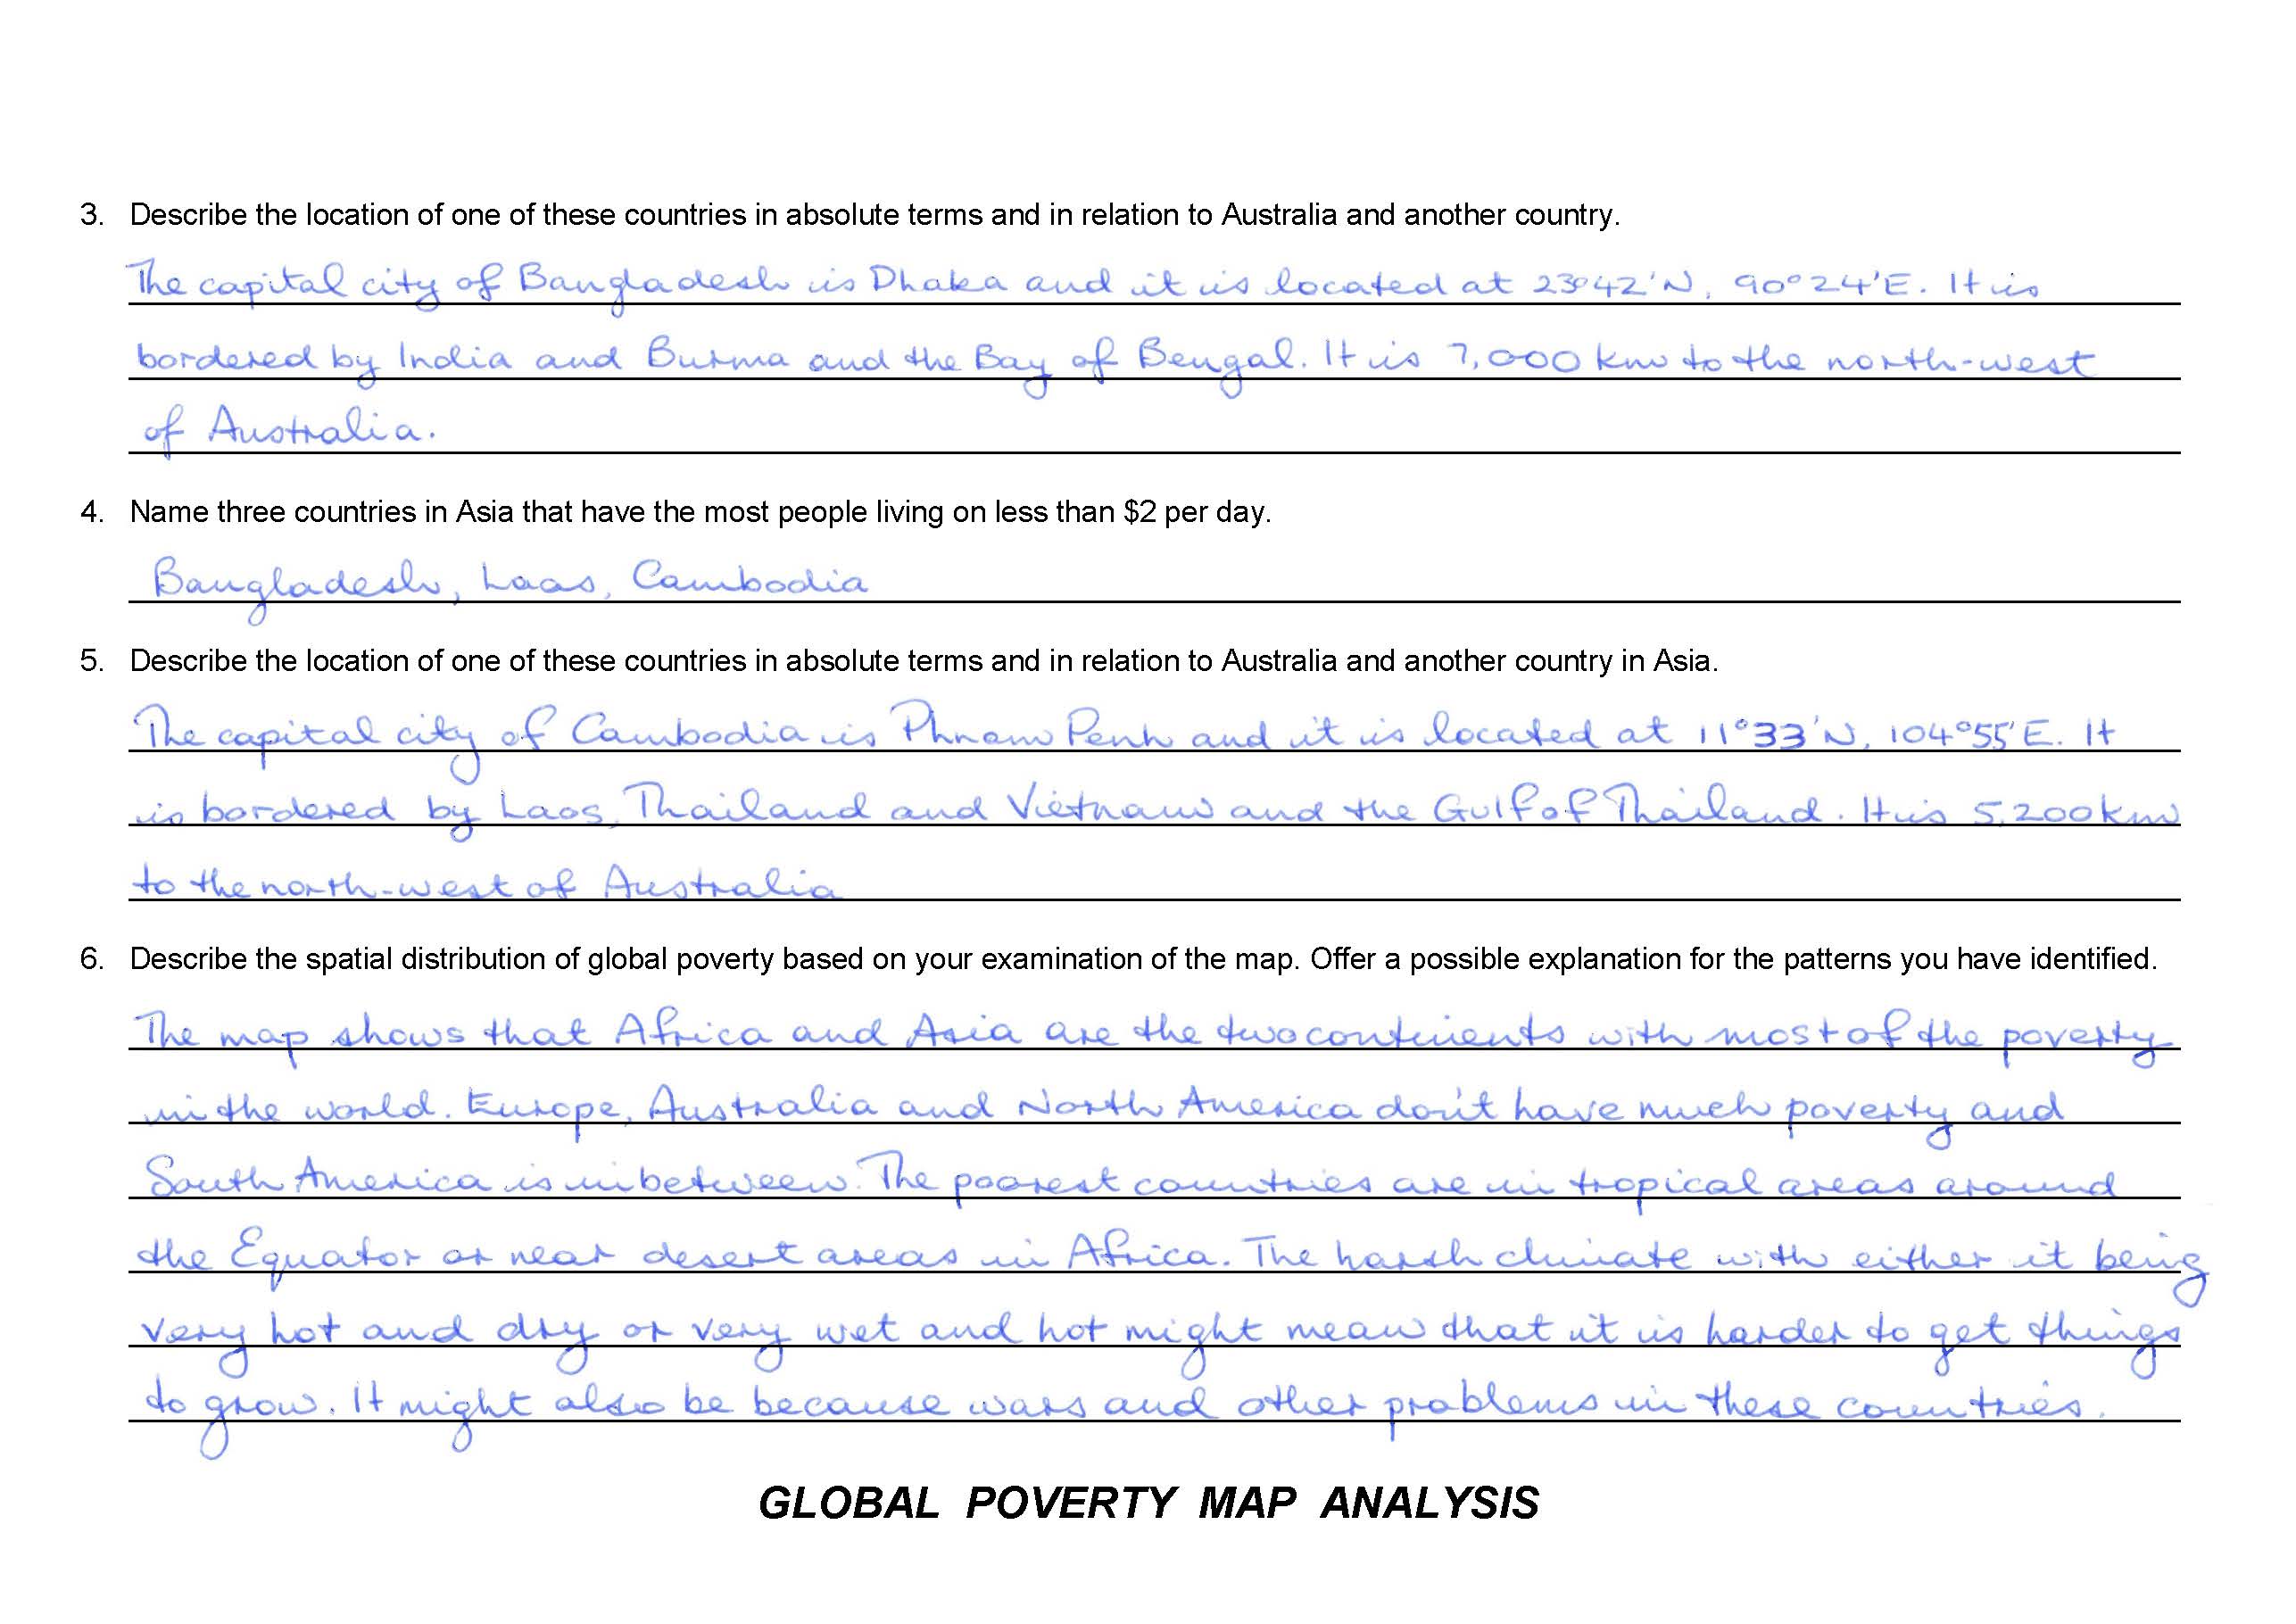
Students were introduced to ways of measuring human wellbeing and the geographical factors associated with the distribution of wealth. They were provided with a choropleth map showing the percentage of each country’s population living on less than $2 a day. They were also provided with an atlas. The task required students to answer a series of questions and draw conclusions using both information sources. The task was completed in class during one 50-minute lesson.
Achievement standard
By the end of Year 6, students describe the location of places in selected countries in absolute and relative terms. They describe and explain the diverse characteristics of places in different locations from local to global scales. They describe the interconnections between people in different places, identify factors that influence these interconnections and describe how interconnections change places and affect people. They identify and compare different possible responses to a geographical challenge.
Students develop appropriate geographical questions to frame an inquiry. They locate, collect and organise useful data and information from primary and secondary sources. They record and represent data and the location of places and their characteristics in different graphic forms, including large-scale and small-scale maps that use cartographic conventions of border, source, scale, legend, title and north point. Students interpret maps, data and other information to identify, describe and compare spatial distributions, patterns and trends, to infer relationships and to draw conclusions. They present findings and ideas using geographical terminology and digital technologies in a range of communication forms. They propose action in response to a geographical challenge and describe the probable effects of their proposal.
 1
2
1
2
-
Annotations
-
1
Learning Area
Uses information sources to identify countries -
2
Subject - Geography
Uses information sources to identify countries
 1
2
3
4
5
6
1
2
3
4
5
6
-
Annotations
-
1
Learning Area
Uses latitude and longitude to locate cities and countries -
2
Learning Area
Describes the relative location and distance between countries and Australia -
3
Subject - Geography
Uses latitude and longitude to locate cities and countries -
4
Subject - Geography
Describes the relative location and distance between countries and Australia -
5
Learning Area
Explains the global distribution of poverty using specific examples -
6
Subject - Geography
Explains the global distribution of poverty using specific examples