A sample is part of a population. It is a subset of the population, often randomly selected for the purpose of estimating the value of a characteristic of the population as a whole. For instance, a randomly selected group of eight-year old children (the sample) might be selected to estimate the incidence of tooth decay in eight-year old children in Australia (the population).
The scale of a map is the ratio of a distance on the map to the corresponding distance on the ground. For example, on a 1:100 000 scale map, 1 cm on the map equals 1 km on the ground.
A scale on a graph when displayed in a legend can indicate the value of the graphing units. If not displayed, the scale is shown by the values associated with the marks on the axes. For example, if the intervals on the vertical axis increase by 5 this sets the scale that each interval on the vertical axis corresponds to 5.
Numbers are expressed as a product of the power of 10 and a decimal that has just one digit to the left of the decimal point; for example, the scientific notation for 34,590 is 3.459×10⁴ and the scientific notation for 0.000004567 is 4.567×10⁻⁶. Scientific notation is a way of writing numbers that are too big or too small to be written in an accessible way.
In the sharing model of division, the divisor indicates a whole number of equal groups and the quotient, the result of division, is the size of each part. In 12 ÷ 3 = 4, twelve is shared into 3 equal groups and there are 4 in each group.
Skip counting is counting in multiples (e.g. three, six, nine, twelve, …).
A mental computation method where numbers are split or decomposed into their place value to make it easier to add them by collecting units of tens and ones separately.
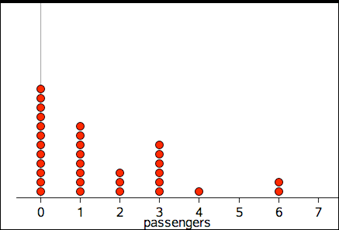
A stacked dot plot is a graph used in statistics for organising and displaying numerical or categorical data. The dots are stacked in a column over a number or category, so that the height of the column represents how many observations are in that category. Dot plots are ideally suited for organising and displaying discrete numerical data.
The dot plot below displays the number of passengers observed in 32 cars stopped at a traffic light.
Recognise the number of objects in a random collection without consciously counting. The term was coined in 1949 by Kaufman et al. and is derived from the Latin adjective subitis (meaning "sudden"). As response times rise rapidly when identifying more than 4 items, subitising random arrangements is usually limited to 4 items.
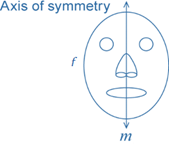
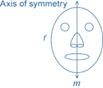
A 2-dimensional geometric figure has symmetry if it appears unchanged by a reflection (line symmetry) or alternatively, a rotation (rotational symmetry). Points on a symmetric figure occur in pairs, equidistant from a line (axis of symmetry) or a point.

A rotation of 120° around O moves the equilateral triangle onto itself.