A sample is part of a population. It is a subset of the population, often randomly selected for the purpose of estimating the value of a characteristic of the population as a whole.
For instance, a randomly selected group of eight-year old children (the sample) might be selected to estimate the incidence of tooth decay in eight-year old children in Australia (the population).
A sample space is the set of all possible outcomes of a chance experiment; for example, the set of outcomes (also called sample points) from tossing two heads is {HH, HT, TH, TT}, where H represents a ‘head’ and T a ‘tail’.
When two variables are numerical then a scatter plot (or bivariate plot) may be constructed. This is an important tool in the analysis of bivariate data, and should always be examined before further analysis is undertaken. The pairs of data points are plotted on a Cartesian plane, with each pair contributing one point to the plot. The following example examines the features of the scatterplot in more detail.
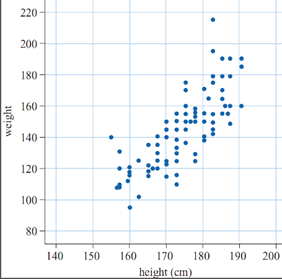
Suppose we record the heights and weights of a group of 100 people. The scatterplot of those data would be 100 points. Each point represents one person's height and weight.
Scientific notation is a distinct way of writing numbers that are too big or too small to be written in an accessible way. Numbers are expressed as a product of the power of 10 and a decimal that has just one digit to the left of the decimal point; for example, the scientific notation for 34,590 is $$3.459\times10^4,$$, and the scientific notation for 0.000004567 is 4.567×10⁻⁶.
Many electronic calculators will show these as 3.459E4 and $$4.567\times10^{-6}.$$.
Secondary data is data collected by others. Sources of secondary data include, web-based data, the media, books, scientific papers, etc.
A sequence is an ordered collection of elements. When written, the elements are separated by commas. Sequences can be finite (e.g., 1, 2, 3, 4), or infinite (1, 2, 3, 4, 5, 6…).
In probability and statistics, a set is a well-defined collection of objects, events or outcomes. Each item within a set is called an element of the set.
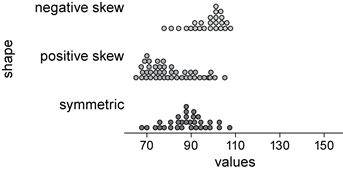
The shape of a numerical data distribution is mostly simply described as symmetric, if it is roughly evenly spread around some central point or skewed, if it is not. If a distribution is skewed, it can be further described as positively skewed (‘tailing-off’ to the upper end of the distribution) or negatively skewed (‘tailing-off’ to the lower end of the distribution).
These three distribution shapes are illustrated in the parallel dot plot display below.
Dot plots, histograms and stem plots can all be used to investigate the shape of a data distribution.
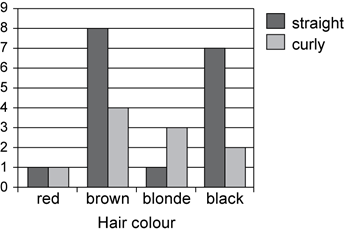
A side-by-side column graph can be used to organise and display the data that arises when a group of individuals or things are categorised according to two or more criteria; for example, the side-by-side column graph below displays the data obtained when 27 children are categorised according to hair type (straight or curly) and hair colour (red, brown, blonde, black). The legend indicates that blue columns represent children with straight hair and red columns children with curly hair.
Side-by-side column graphs are frequently called side-by-side bar graphs or bar charts. In a bar graph or chart, the bars can be either vertical or horizontal.
Similarity (general):
Two plane figures are called similar if an enlargement of one figure is congruent to the other.
That is, if one can be mapped to the other by a sequence of translations, rotations, reflections and enlargements.
Similar figures thus have the same shape, but not necessarily the same size.
Similarity (triangles):
There are four standard tests to determine if two triangles are similar
AAA: If two angles of one triangle are respectively equal to two angles of another triangle, then the two triangles are similar.
SAS: If the ratio of the lengths of two sides of one triangle is equal to the ratio of the lengths of two sides of another triangle, and the included angles are equal, then the two triangles are similar.
SSS: If we can match up the sides of one triangle with the sides of another so that the ratios of matching sides are equal, then the two triangles are similar.
RHS: If the ratio of the hypotenuse and one side of a right-angled triangle is equal to the ratio of the hypotenuse and one side of another right-angled triangle, then the two triangles are similar.
Simple interest is the interest accumulated when the interest payment in each period is a fixed fraction of the principal; for example, if the principle $P earns simple interest at the rate of i% per period, then after n periods the accumulated simple interest is $Pni/100.
Two or more equations form a set of simultaneous equations if there are conditions imposed simultaneously on all of the variables involved.
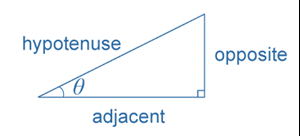
In any right-angled triangle, the sine of an angle is defined as the length of the side opposite the angle divided by the length of the hypotenuse; $$\sin\theta=\frac{\text{opposite}}{\text{hypotenuse}}$$ , where 0°<θ<90°.
In any triangle ABC, $$\frac a{\sin A}=\frac b{\sin B}=\frac c{\sin C}$$.
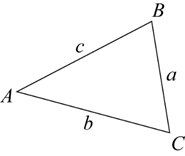
In words it says:
Any side of a triangle over the sine of the opposite angle equals any other side of the triangle over the sine of its opposite angle.
Skewness is a measure of asymmetry (non-symmetry) in a distribution of values about the mean of a set of data.
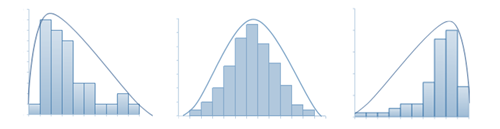
In the diagrams below, the histogram to the left is positively skewed. Data values are concentrated at the beginning of the number line, causing the graph to have a long tail to the right and a very short tail to the left. The histogram to the right is negatively skewed. Data values are concentrated further right along the number line, causing the graph to have a long tail to the left and a very short tail to the right. The mode, median and mean will not coincide.
When the distribution of values in a set of data is symmetrical about the mean, the data is said to have normal distribution. The histogram in the middle is normally distributed.
Skip counting is counting by a number that is not 1; for example, skip counting forwards by 2 would be 2, 4, 6, 8, 10, 12, 14, 16, 18, 20
A solid is any three-dimensional geometrical figure.
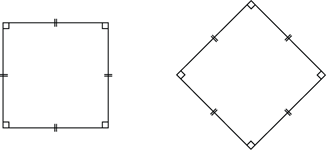
A square is a quadrilateral that is both a rectangle and a rhombus. A square thus has all the properties of a rectangle, and all the properties of a rhombus.
Standard deviation is a measure of the variability or spread of a data set. It gives an indication of the degree to which the individual data values are spread around their mean.
A stem-and-leaf plot is a method of organising and displaying numerical data in which each data value is split in to two parts, a ‘stem’ and a ‘leaf’; for example, the stem-and-leaf plot below displays the resting pulse rates of 19 students.
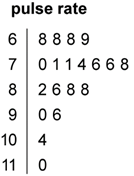
In this plot, the stem unit is ‘10’ and the leaf unit is ‘1’. Thus the top row in the plot 6 | 8 8 8 9 displays pulse rates of 68, 68, 68 and 69.
Stemplot is a synonym for stem-and-leaf plot.
A straight angle is half a revolution, and so is equal to 180°.

Subitising refers to the recognition of the number of objects in a collection without consciously counting.
In probability and statistics, a set is a well-defined collection of objects, events or outcomes. Each item within a set is called an element of the set. If every element in set 1 is also in set 2, then set 1 is a subset of set 2.
In a random experiment, each event or outcome is a subset of the broader sample space.
A sum is the result of adding together two of more numbers or algebraic expressions. In the equation
Two angles that add to 180° are called supplementary angles; for example, 45° and 135° are supplementary angles.
A surd is a numerical expression involving one or more irrational roots of numbers. Examples of surds include $$\sqrt[{}]2,$$,$$\sqrt[3]{5,}\;$$ and $$\;4\sqrt[{}]3+7\sqrt[3]6$$
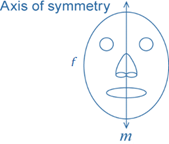
A plane figure f has line symmetry in a line m, if the image of f under the reflection in m is f itself. The line m is called the axis of symmetry.
A plane figure f has rotational symmetry about a point O if there is a rotation such that the image of f under the rotation is f itself.

A rotation of 120° around O moves the equilateral triangle onto itself.