When two variables are numerical then a scatter plot (or bivariate plot) may be constructed. This is an important tool in the analysis of bivariate data, and should always be examined before further analysis is undertaken. The pairs of data points are plotted on a Cartesian plane, with each pair contributing one point to the plot. The following example examines the features of the scatterplot in more detail.
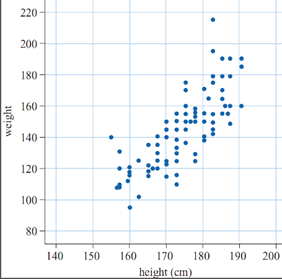
Suppose we record the heights and weights of a group of 100 people. The scatterplot of those data would be 100 points. Each point represents one person's height and weight.